
Given that the air quality is going to shit in m y area again, I figured I’d show off my air quality cards! Let me know if you have any questions. The colors for the AQI cards are from US EPA’s color set and the the PM2.5 color values are based off EPA’s PM2.5 exposure over 24 hours
 ^ These are based off the stock gauge card.
type: gauge
entity: sensor.airnow_aqi
name: AQI
unit: ' '
needle: true
min: 20
max: 500
segments:
  - from: 0
    color: '#00e400'
  - from: 51
    color: '#ffff00'
  - from: 101
    color: '#ff7e00'
  - from: 151
    color: '#ff0000'
  - from: 201
    color: '#8f3f97'
  - from: 301
    color: '#800000'
type: gauge
entity: sensor.airnow_pm2_5
name: PM2.5
needle: true
min: 0
max: 200
segments:
  - from: 0
    color: '#64a13c'
  - from: 12.6
    color: '#eac51c'
  - from: 26
    color: '#d67900'
  - from: 51
    color: '#a90737'
  - from: 151
    color: '#50051e'
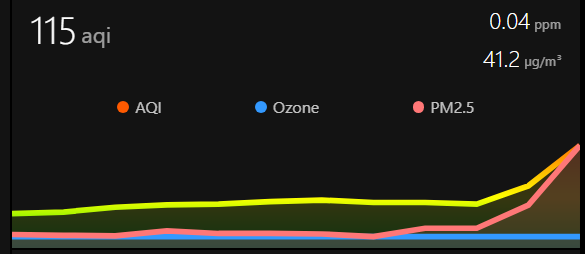 ^ This one is based off the mini-graph-card, which I really like.
type: custom:mini-graph-card
name: Air Quality
icon: mdi:air-purifier
hours_to_show: 12
points_per_hour: 1
smoothing: false
color_thresholds:
  - value: 0
    color: '#00e400'
  - value: 51
    color: '#ffff00'
  - value: 101
    color: '#ff7e00'
  - value: 151
    color: '#ff0000'
  - value: 201
    color: '#8f3f97'
  - value: 301
    color: '#800000'
entities:
  - entity: sensor.airnow_aqi
    name: AQI
  - entity: sensor.airnow_o3
    name: Ozone
    color: '#3399ff'
    show_state: true
  - entity: sensor.airnow_pm2_5
    name: PM2.5
    color: '#ff7777'
    show_state: true
    y_axis: secondary
These are great!! I didn’t even know about the AirNow integration!
Glad you like them! Now you gotta share whatever you build :)
I was originally using the Airvisual cloud integration, which wasn’t accurate at all. I found the Airnow one right when the wildfire smoke got bad around here and it made a huge difference.