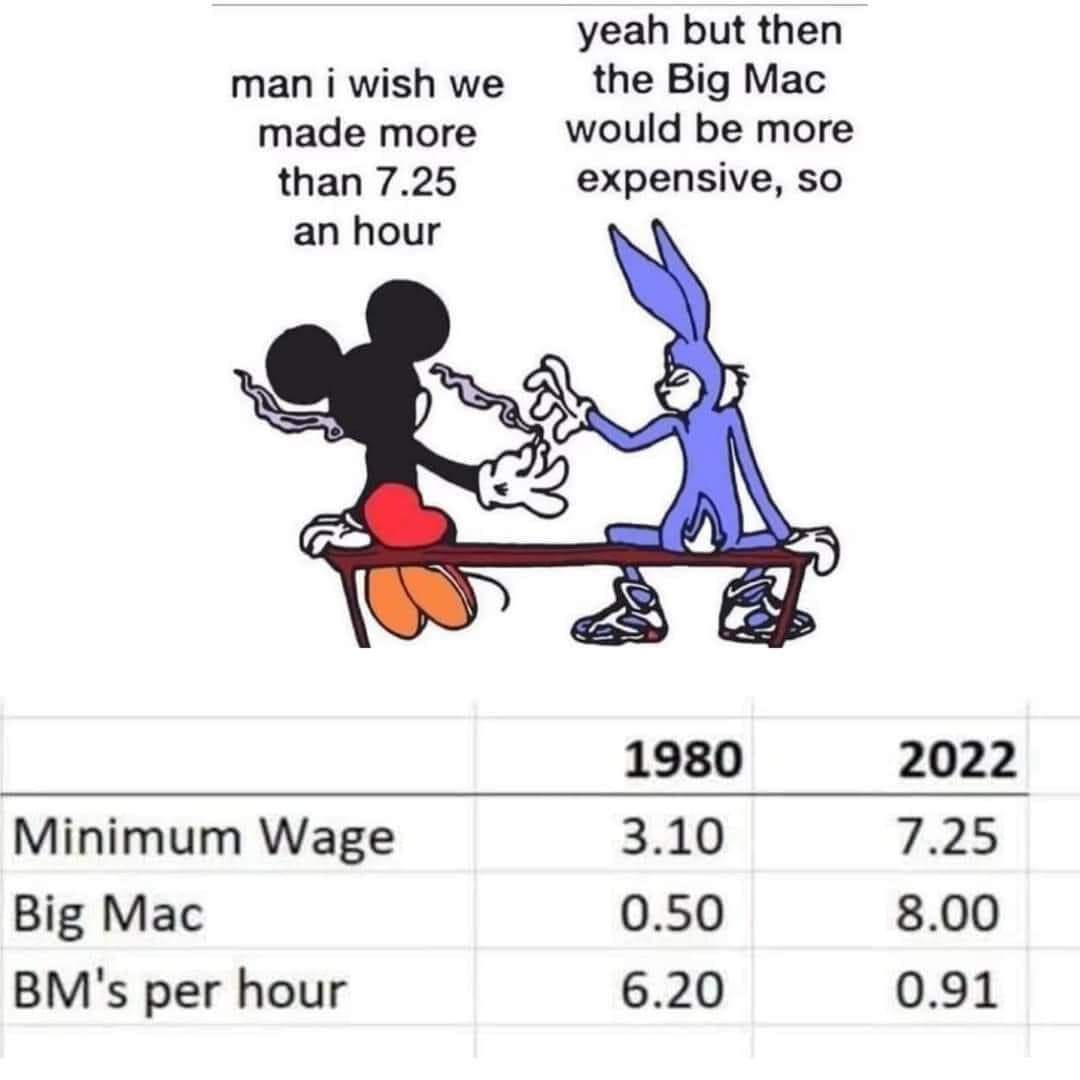
Since we’re directly comparing the price of a product over time, aren’t we already taking inflation into account? Like this is a direct depiction of inflation and the fact that minimum wage hasn’t kept up.
I think Red_Sunshine is referring to both compared to the CPI. Since 1980 the CPI has risen 355%, while the minimum wage has risen 233% and the big mac has risen 1600%. So the price of a big mac has outpaced CPI by a factor of nearly 5 while wages have underpaced by factor 0.66.
Damn, I would have expected it to be something that stuck close to the average inflation of all consumer products (CPI, I guess). Like that graph would be completely expected if we were talking about housing, but not a burger.


It would be more damming if the 1980 figures were adjusted for inflation. Especially the minimum wage.
Since we’re directly comparing the price of a product over time, aren’t we already taking inflation into account? Like this is a direct depiction of inflation and the fact that minimum wage hasn’t kept up.
I think Red_Sunshine is referring to both compared to the CPI. Since 1980 the CPI has risen 355%, while the minimum wage has risen 233% and the big mac has risen 1600%. So the price of a big mac has outpaced CPI by a factor of nearly 5 while wages have underpaced by factor 0.66.
For visual learners:
Damn, I would have expected it to be something that stuck close to the average inflation of all consumer products (CPI, I guess). Like that graph would be completely expected if we were talking about housing, but not a burger.
What’s a product that has stuck close to CPI?
Does it show monopoly pricing, as well, maybe?
Yeah campbell tomato soup index is my favorite inflation measure. According to it, the dollar has lost 10x it’s value since 1971.
but it doesn’t really factor in campbell becoming more greedy over time
so it’s literally in the negatives? Didn’t know things were that bad…
I think it hits harder if it’s in “units you can relate to on a visceral level”
I think “big macs per hour” is probably the most viscerally relatable metric for the average American
$11.85/hr
$1.85/bm
The prevailing minimum wage at a job I started a few years ago was well under that.
Yup. And that’s not even accounting for disproportionate inflation in the necessity basket. Just market inflation.
I guess the cost of food being so insanely inflated shows up in this comparison, but housing and loan/consumer credit isn’t